Monitoring
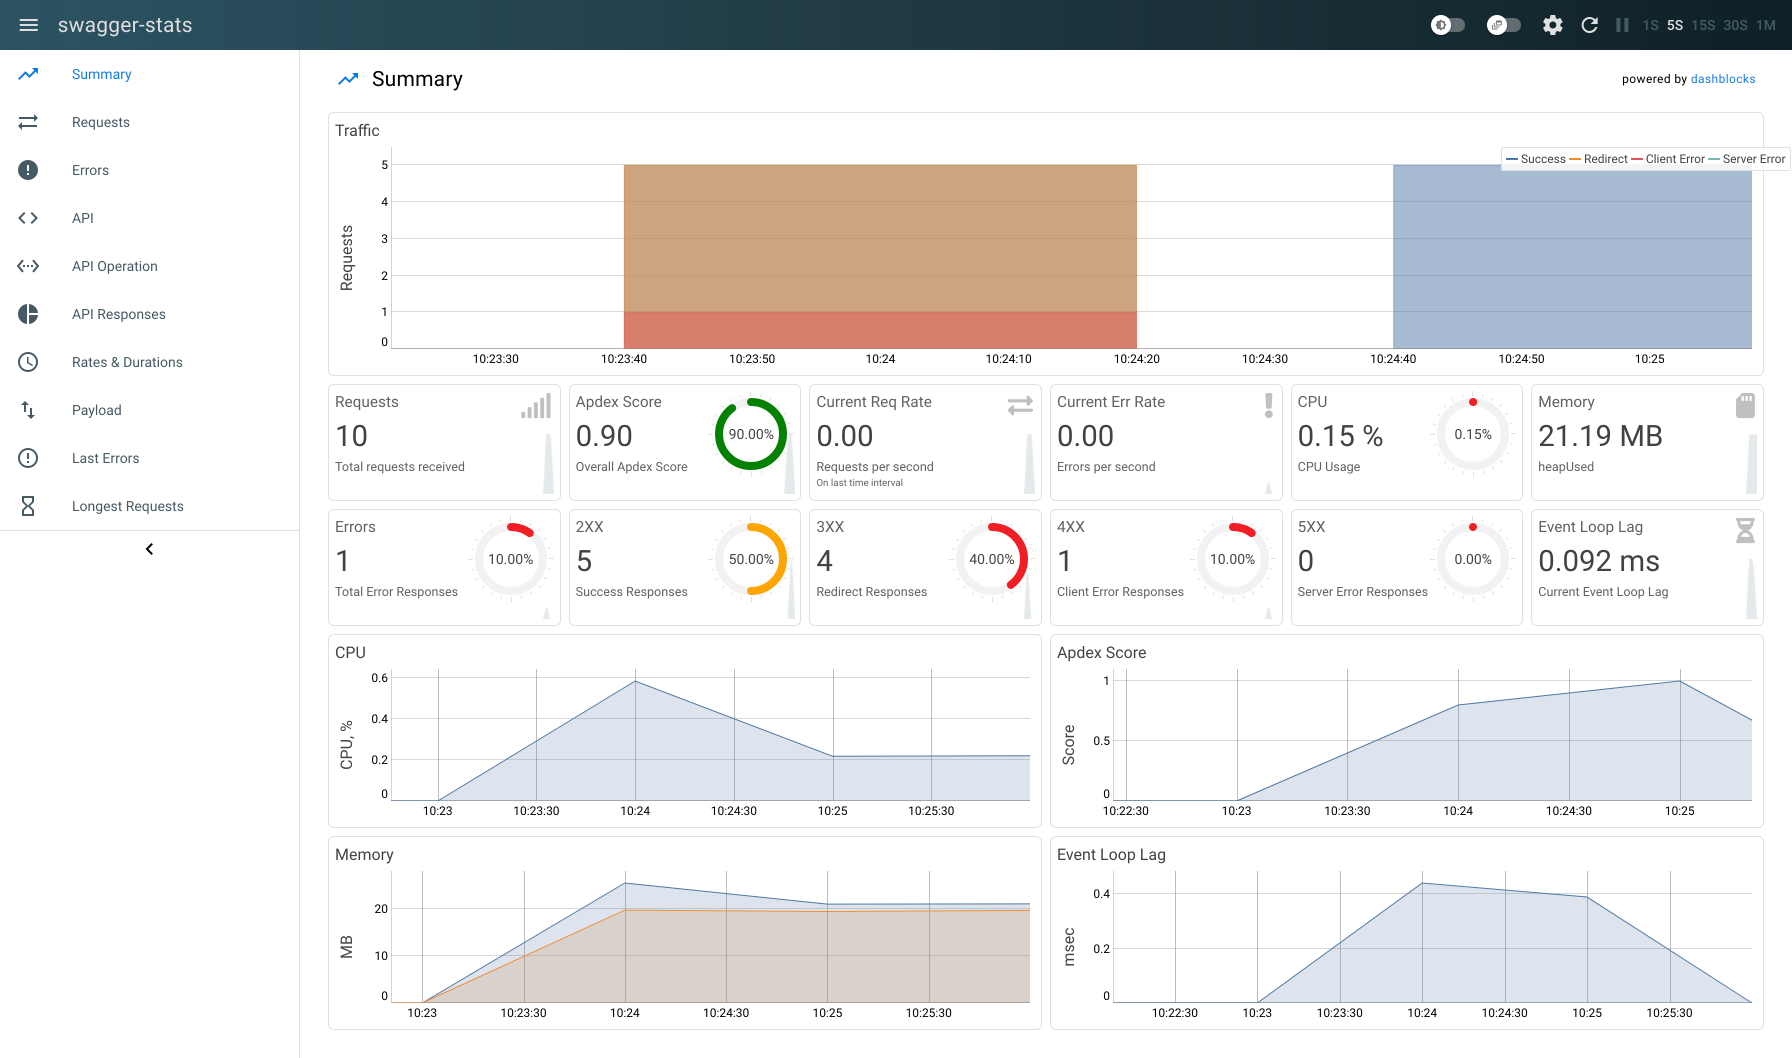
Monitoring might not be of paramount importance when you are running unit tests or functional automation tests, but if you plan to use Camouflage for performance testing purposes, you would definitely need some monitoring in place. Thanks to swagger-stats, Camouflage provides you two options. You can use the inbuilt UI provided by swagger-stats by navigating to http://localhost:8080/monitoring, which will lead you to following dashboard updating itself in real time
Note
If you are running more than one worker, the above UI would not provide you aggregated metrics. Data displayed will be worker specific data and at this point, we don't have a control on which worker's data will be displayed. Every time UI refreshes, the displayed data might belong to any of the running workers.
To provide the aggregated metrics, Camouflage runs a separate monitoring server, which runs by default on port 5555. The URL http://localhost:5555/metrics acts as a scraping endpoint for your Prometheus server. Store this data in Prometheus and then use Grafana to generate your own visualizations. You can install a Prometheus DB and configure it to scrape from /metrics endpoint, and use that data to create charts for monitoring your application.
Danger
Disable monitoring by setting a negative value to config.monitoring.port in config.yaml.
Sample Prometheus yml
global:
  scrape_interval: 15s
  evaluation_interval: 15s
scrape_configs:
  - job_name: "camouflage"
    static_configs:
      - targets: ["localhost:5555"]
Note
Update the target with your IP and port if running remotely or if you have specified a different port while starting Camouflage